---blog Title---
Top 5 Integrations to Maximize Adobe Analytics and Power BI Efficiency
---desktop---

---mobile---
Businesses today face no shortage of data. From website interactions to sales metrics, the challenge is not in gathering data but in making sense of it all. This is where tools like Adobe Analytics and Power BI come into play, helping companies transform raw numbers into insights that drive action.
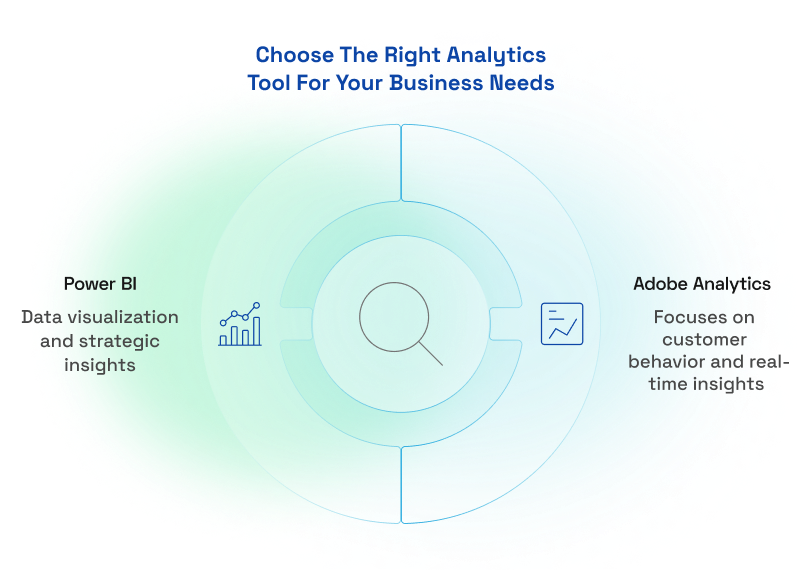
Adobe Analytics is built to dissect digital behavior—tracking how users interact with websites, apps, and campaigns. For a closer look at how Adobe Analytics compares with other platforms, explore this guide on choosing the right analytics platform. Power BI, on the other hand, takes the role of an all-rounder, unifying data from multiple sources and turning it into easy-to-read visual dashboards. Each is indispensable in its own way, but relying on them separately can create blind spots.
For example, Adobe Analytics might tell you how users are navigating your website, but without a broader operational view, you might miss how those behaviors connect to sales. Similarly, Power BI offers a clear picture of your business performance but can fall short in analyzing the nitty-gritty of customer journeys. A comprehensive analytics comparison can help you understand their complementary strengths.
By integrating the two, you can bridge these gaps. This article will guide you through understanding their strengths, why they work so well together, and the top ways to seamlessly connect them. If you have been struggling to turn data into decisions, this could be the game-changer your business needs.
Comparing Adobe Analytics vs. Power BI
Both Adobe Analytics and Power BI are exceptional tools, but they serve distinct purposes. Understanding what each one brings to the table is the first step in seeing why they complement each other so well. When comparing analytics tools, it is essential to understand their core capabilities and use cases they serve.
Core Functionality and Strengths
Adobe Analytics is laser-focused on understanding customer behavior. It tracks every click, swipe, or interaction on your website or app, offering unparalleled insight into what your audience is doing and why. As of January 2024, Adobe Analytics is utilized by 0.1% of all websites that use a known traffic analysis tool.
Whether it is segmenting your users into precise groups or mapping out their journey, Adobe Analytics ensures you can follow every digital breadcrumb. Learn how to maximize these insights with strategies for optimizing your Adobe Analytics investment.
On the other hand, Microsoft's Power BI is the ultimate multitasker when it comes to analyzing and presenting data. Its strength lies in its flexibility—it pulls in data from different systems, organizes it, and delivers intuitive visualizations that anyone can understand, from front-line managers to boardroom executives.
Differences in Data Handling
One critical distinction between the two tools lies in how they manage data:
- Adobe Analytics focuses on real-time, detailed tracking. It is designed to help you spot what is happening as it happens—like a spike in website traffic or a sudden drop in conversions.
- Power BI is built for a more holistic view. It aggregates data, allowing you to see trends over time or compare performance across departments. It is less about the minute-by-minute and more about the big picture.
Use Cases for Adobe Analytics vs. Power BI
Adobe Analytics is your go-to tool when you need a detailed understanding of how customers interact with your digital platforms. It provides granular insights into behaviors like navigation patterns, content engagement, and conversion paths, helping you refine experiences in real-time.
On the other hand, Power BI is ideal for analyzing and presenting customer data in the context of broader business metrics. By consolidating information from multiple sources, it reveals trends and opportunities that inform strategic decisions, such as sales performance, customer satisfaction, and campaign effectiveness.
Together, these marketing analytics tools offer a powerful combination of precision and perspective.
Adobe Analytics: Deep Behavioral Insights
- Tracking Website and App Interactions: Monitor every user action on your digital platforms to identify friction points and improve usability.
- Building Customer Segments: Create precise audience profiles based on behavior for more targeted marketing.
- Mapping Customer Journeys: Visualize the entire customer journey to uncover optimization opportunities.
- Optimizing Campaign Performance: Analyze real-time campaign data to maximize ROI.
- Improving Mobile App Engagement: Track app usage patterns to enhance user experience and retention.
Power BI: Data Visualization and Strategic Insights
- Creating Customer-Focused Dashboards: Combine customer data from multiple sources into dynamic, easy-to-read dashboards.
- Monitoring Sales and Customer Metrics: Visualize KPIs like churn, lifetime value, and satisfaction for actionable insights.
- Analyzing Customer Support Performance: Assess support data to improve resolution times and customer satisfaction.
- Spotting Cross-Selling and Upselling Opportunities: Identify purchasing trends to drive additional revenue opportunities.
- Aligning Marketing and Sales Data: Integrate campaign and sales data to ensure teams work toward shared goals.
The Importance of Integration between Adobe Analytics and Power BI
Without integration, Adobe Analytics and Power BI operate in silos, limiting their potential. Adobe Analytics excels at capturing granular customer behaviors, but without connecting this data to broader operational metrics, it can be difficult to contextualize those insights within overall business performance. Similarly, Power BI is a powerhouse for visualizing trends and consolidating data, but it lacks the depth to analyze intricate web and app behaviors on its own.
This disconnect often results in fragmented decision-making, where critical insights are either missed or misinterpreted due to incomplete data flow between platforms. Integration bridges these gaps, providing a unified view that is essential for data-driven strategies. If scaling personalization is part of your strategy, Adobe's tools combined with Power BI can provide unparalleled support.
Bridging Behavioral and Operational Insights
Adobe Analytics captures the "what" and "why" behind customer actions, while Power BI shows the broader impact of those actions on business performance. For example, Adobe Analytics might reveal that a spike in traffic is coming from a specific campaign, but when paired with Power BI, you can also see how that traffic contributes to sales, retention, or upsell opportunities. This combined view ensures that teams across marketing, sales, and operations are working with a unified understanding of both customer behavior and its business impact.
Enhancing Collaboration across Teams
When data from Adobe Analytics flows seamlessly into Power BI, it removes barriers between departments. Marketing teams can use behavioral insights to refine strategies, while leadership teams access those same insights through Power BI dashboards to make informed, high-level decisions. For instance, insights from a high-performing campaign identified in Adobe Analytics can be visualized in Power BI to demonstrate its contribution to revenue, ensuring alignment between execution and strategy.
Overcoming Common Analytical Gaps
Integration also solves some of the most common challenges in analytics:
- Attribution clarity: By merging Adobe Analytics data with Power BI's broader datasets, businesses can more accurately map customer journeys and pinpoint which touchpoints drive conversions.
- Enhanced visualization: While Adobe Analytics provides deep behavioral insights, Power BI's flexible reporting tools make it easier to communicate those insights to stakeholders, ensuring actionable takeaways.
With integration, these platforms work as one, empowering businesses to make better, faster decisions while maintaining a customer-first approach.
Top 5 Integrations to Maximize Efficiency
Integrating Adobe Analytics and Power BI can transform how businesses utilize data, but achieving seamless integration requires the right approach. Here are five effective strategies to connect these top marketing analytical tools and maximize efficiency.
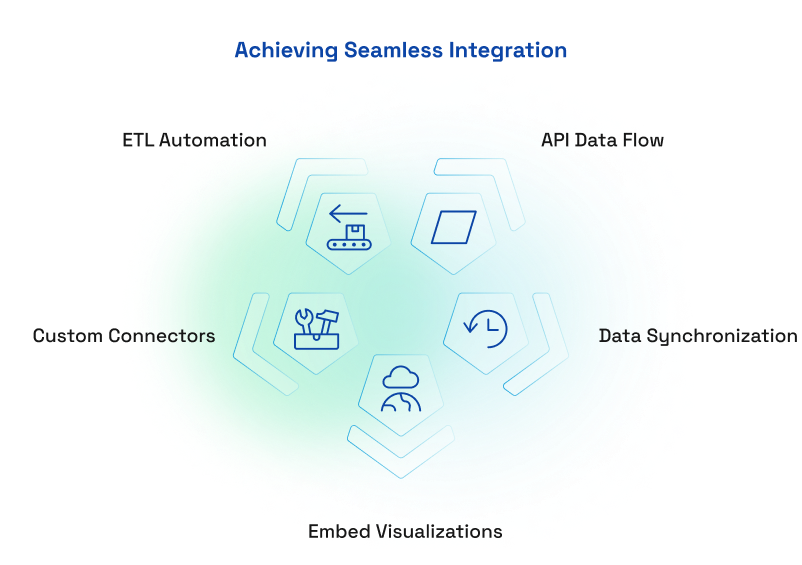
1. API-Based Data Flow
The Adobe Analytics API allows businesses to transfer data directly into Power BI, ensuring real-time synchronization.
- How It Works: By using the API, businesses can customize data queries to bring the most relevant metrics and dimensions into Power BI.
- Steps to Implement:
- Obtain your Adobe Analytics API credentials from the admin console.
- Set up a connection in Power BI using its "Get Data" feature.
- Customize queries to pull the data you need, like traffic metrics, campaign performance, or user behaviors.
- Benefits: This approach ensures live updates, offering immediate insights for decision-making.
2. Custom Data Connectors
Third-party connectors, such as prebuilt plugins or extensions, simplify the integration process.
- Examples: Tools like Adobe Analytics Connect or Power BI certified connectors offer quick setup for less technical users.
- Pros: They are user-friendly and save time by avoiding manual setup.
- Cons: They may have limitations in terms of customization and scalability for complex data needs.
3. Data Layer Synchronization
Aligning metrics and dimensions across both platforms ensures consistent reporting.
- Why It Matters: Discrepancies in naming conventions, date ranges, or calculation methods can lead to mismatched data, creating confusion and eroding trust in reports.
- Best Practices:
- Standardize naming conventions for metrics and dimensions in both systems.
- Establish clear mapping rules to align Adobe Analytics event-level data with Power BI's aggregated data structures.
- Regularly audit synchronized data to maintain accuracy.
4. Automation Through ETL Pipelines
Extract, transform, and load (ETL) pipelines streamline data integration by automating the flow between Adobe Analytics and Power BI.
- Tools to Use: Platforms like Azure Data Factory or Informatica can automate data extraction from Adobe Analytics, transform it into usable formats, and load it into Power BI.
- Workflow Tips:
- Schedule data updates to occur during low-traffic periods to reduce server strain.
- Predefine transformation rules to clean Adobe Analytics data before importing it into Power BI.
- Efficiency Gains: This automation reduces manual intervention, minimizes errors, and ensures fresh data is always available.
5. Embedding Power BI Visualizations in Adobe Workspaces
For teams that rely heavily on Adobe Analytics Workspaces, embedding Power BI dashboards can enhance reporting capabilities.
- How It Works: Power BI dashboards can be embedded as iFrames or live links within Adobe Workspaces, allowing users to view operational metrics alongside behavioral insights in one interface.
- Steps:
- Generate embed codes for Power BI dashboards.
- Add them to your Adobe Analytics Workspace as custom components.
- Benefits: This creates a bi-directional flow of insights, empowering teams to make data-driven decisions without switching tools.
By implementing these integrations, businesses can unlock the full potential of Adobe Analytics and Power BI, ensuring every insight is actionable and aligned with business goals.
Challenges and Solutions in Integrating Adobe Analytics and Power BI
Integrating Adobe Analytics and Power BI unlocks powerful insights, but the process is not without its obstacles. By anticipating these challenges and proactively implementing these analytics tools, businesses can ensure a smoother integration process. Overcoming these obstacles not only enhances the functionality of Adobe Analytics and Power BI but also ensures that the data insights derived are reliable, actionable, and impactful.
1. Complex API Setup
Configuring the Adobe Analytics API to work with Power BI can be technically demanding, especially for teams without in-house expertise. Issues such as authentication errors, incorrect query parameters, or mismatched data structures can lead to delays and frustration. Moreover, the Adobe Analytics API has built-in limits (a maximum of 50,000 rows per API call), which may restrict the volume of data retrieved in a single request. Users might need to implement pagination or segment their requests accordingly.
Start with detailed documentation provided by Adobe and Power BI. These resources often include step-by-step instructions for setting up API connections. For teams with limited technical knowledge, involving a data engineer or outsourcing the initial configuration can be a worthwhile investment. Additionally, test connections with smaller datasets before scaling up to avoid unexpected issues.
2. Discrepancies in Data Definitions
Metrics like "unique visitors" or "sessions" are calculated differently in Adobe Analytics compared to Power BI, leading to inconsistent reporting. Similarly, mismatched time zones, date ranges, and levels of data granularity can create confusion.
Establish a standardized framework for how key metrics are defined and calculated across both tools. Align data settings, such as time zones and reporting periods, before syncing. Regular audits of synchronized data can also help catch and resolve discrepancies early. Use Power BI's query editor to map Adobe Analytics data fields to consistent formats.
3. Custom Data Connector Limitations
While third-party connectors simplify integration, they often lack flexibility. Fixed configurations may not support advanced data needs, and businesses can become reliant on vendors to maintain and update the connectors.
Choose connectors that allow for some level of customization, enabling you to tailor data queries to your specific requirements. Prioritize connectors from reputable providers with a history of regular updates and strong customer support. If your data needs are highly complex, consider building a custom connector with the help of technical experts.
4. Performance Issues with ETL Pipelines
Extracting, transforming, and loading large datasets from Adobe Analytics into Power BI can strain systems, resulting in slow processing times or incomplete data transfers. Additionally, raw data often requires cleaning and restructuring, which can be time-consuming.
Use scalable ETL tools like Azure Data Factory or Informatica that are designed to handle large volumes of data efficiently. Predefine transformation rules to standardize and clean data automatically before importing it into Power BI. Schedule ETL processes during off-peak hours to minimize system load and optimize performance.
5. Embedding Dashboards and User Adoption
While embedding Power BI dashboards in Adobe Workspaces offers significant advantages, compatibility issues or slow load times can disrupt the user experience. Additionally, teams may not fully understand how to leverage embedded dashboards for actionable insights.
Test Power BI dashboards for compatibility before embedding them in Adobe Workspaces, and optimize them by reducing unnecessary visuals or data points. To address user adoption, provide training sessions and clear documentation that explains how to interpret and act on the insights displayed. Offering hands-on examples tailored to your team's workflows can encourage adoption and build confidence.
Conclusion
Connecting Adobe Analytics and Power BI is more than just a technical endeavor—it is a business-critical step toward smarter, more unified decision-making. These tools, each a leader in its own space, become even more powerful when integrated. Adobe Analytics provides unparalleled insights into customer behavior, while Power BI brings operational data to life with its ability to visualize and analyze trends. Together, they give businesses the clarity they need to act with confidence.
But integration is not without its challenges. From aligning metrics to managing data security, success depends on careful planning and execution. This is not a "set it and forget it" process—it requires ongoing attention to ensure your data remains accurate, actionable, and compliant.
Ultimately, the value lies in the insights. When you can see the whole story—how customers interact with your website, how those actions translate to revenue, and where operational inefficiencies might be holding you back—you are equipped to make decisions that truly drive results.
This integration is not just about data; it is about using that data to achieve better outcomes. It is about ensuring that your teams, from marketing to operations to leadership, are all working from the same source of truth. And when that happens, the impact goes far beyond better dashboards—it leads to real, measurable business growth.