How to Do a MarTech Audit And Actually Fix What Is Disconnected
Written by: Sanjana R
Updated on: 05-06-2026

component: CxAuditStickySection leftVariant: text progressTitle: "AUDIT PROGRESS" progressLabels:
- SIGNALS
- METRICS
- AUDIT stickySequence:
Section: Intro (opening paragraphs before first h2)
- cardTitle: "Still guessing where it breaks?" cardText: "Most teams trust the tools they pay for. A MarTech audit finds what dropped." leftCta: text: "Book a MarTech Audit" url: "https://www.xerago.ai/bootcamp/"
Section: Signs Your MarTech Stack Has an Operational Problem
- cardTitle: "Still explaining away the symptoms?" cardText: "Most teams call it a workaround. A MarTech audit calls it a break." leftCta: text: "Book a MarTech Audit" url: "https://www.xerago.ai/bootcamp/"
Section: Metrics You Need Before the Audit Begins
- cardTitle: "Still missing half these numbers?" cardText: "Most teams measure what the dashboard shows. The audit finds what it hides." leftCta: text: "Book a MarTech Audit" url: "https://www.xerago.ai/bootcamp/"
Section: MarTech Metrics Scorecard
- cardTitle: "Still missing half these numbers?" cardText: "Most teams measure what the dashboard shows. The audit finds what it hides." leftCta: text: "Book a MarTech Audit" url: "https://www.xerago.ai/bootcamp/"
Section: The MarTech Audit Framework
- cardTitle: "Still auditing tools in isolation" cardText: "Most teams stop at the stack layer. The audit goes where the data actually drops." leftCta: text: "Book a MarTech Audit" url: "https://www.xerago.ai/bootcamp/"
Section: How to Do a MarTech Audit
- cardTitle: "Still unsure where to start?" cardText: "Most teams see the symptom. The audit traces it back to the exact break." leftCta: text: "Book a MarTech Audit" url: "https://www.xerago.ai/bootcamp/"
Section: You Know Campaigns Are Breaking. Now Find Why.
- cardTitle: "Still watching campaigns underperform?" cardText: "Most teams blame the strategy. A MarTech audit finds the system behind it." leftCta: text: "Book a MarTech Audit" url: "https://www.xerago.ai/bootcamp/"
A new marketing operations manager joins on a Tuesday. By Friday she has three questions nobody can answer
- Why do we have two tools that do the same thing?
- Who owns the integration between the CDP and the campaign platform because it has not synced in eleven days?
- Why does the same customer show a different history in the CRM and the analytics platform?
The answers are variations of the same thing.
That is just how it works here. We have a workaround for that. Nobody has looked at that in a while.
She is not asking because she is new. She is asking because these are the questions that should have been asked years ago and never were.
Every martech stack reaches this point. Tools added for good reasons. Integrations built to solve immediate problems. Workarounds that became permanent. It compounded quietly until someone asked why.
65.7 percent of MarTech failures are caused by poor integration and broken data flows. Not wrong tools. What happens between them? (Ascend2 2025)
That number never shows up in a dashboard. It shows up in campaigns that launch late. Audiences that never sync. Budgets spent on capability that was never properly connected.
A MarTech audit is a structured investigation of every tool integration data flow and workflow inside your marketing technology stack. It is the foundation of any meaningful MarTech optimization effort.
It works against your actual environment to find exactly where platforms are failing to connect, where data is dropping, and what that disconnection is costing every month it stays unfound.
The campaign did not fail. The system behind it did. A MarTech audit finds which system, why it failed, and what it costs to leave it unfound.
This is how you find what the dashboard never shows you.
Signs Your MarTech Stack Has an Operational Problem
Most MarTech problems get misdiagnosed. The focus stays on the tools or on MarTech consolidation while the connections between them never get examined.
Nearly two thirds of marketing organizations report data integration as their biggest operational challenge. The tools are not the problem. What happens between them is. (MarTech 2025 State of Your Stack Survey)
Here is what that looks like in practice.
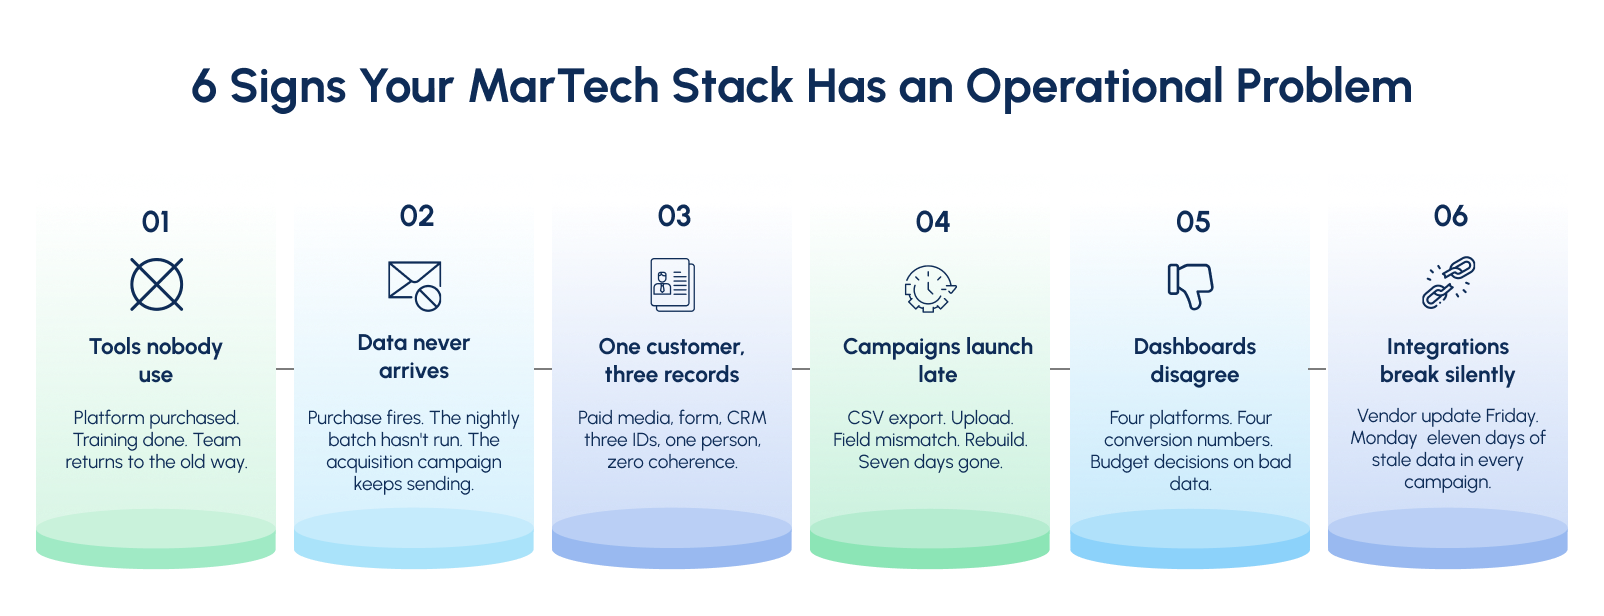
01. Tools Nobody Actually Uses
The platform was purchased. Implementation happened. Training happened. Then the team went back to working the way they did before because the new tool required three other systems to be updated and nobody had time.
Customers who feel genuinely known by a brand stay 5.1 years longer and deliver 306 percent higher lifetime value. That is not a CX goal. That is the financial return on fixing what the audit finds. (Gartner)
02. Data That Never Arrives
A customer completes a purchase on Tuesday. By Thursday they are still receiving acquisition campaigns offering a discount on something they already bought.
The purchase event fired correctly. It just never reached the next platform. The integration runs on a nightly batch job. By the time the segment updates the damage is already done. The team sees an underperforming campaign. Nobody connects the two.
03. One Customer. Three Records.
Paid media assigns one ID. The form submission creates another. The CRM creates a third. Three platforms. Three identities. One person.
Retargeting keeps running after the demo is booked. Onboarding fires without product context. Sales reach out cold because their system shows no prior engagement. Every platform that creates its own identity for the same customer adds another layer of complexity that compounds with every campaign.
04. Campaigns That Launch Late
The brief was approved two weeks ago. The campaign is still not live.
The segment had to be built manually because the CDP and the MAP do not share a direct integration. Exported as a CSV. Uploaded. Rejected because a field mapped differently between systems. Rebuilt. Validated across three platforms. Seven days added to a campaign that should have launched in forty eight hours.
05. Dashboards That Disagree
The weekly review opens with a familiar problem. The ESP reports four thousand conversions. The CRM shows two thousand eight hundred. The analytics platform shows three thousand four hundred.
Everyone has a different number. Nobody agrees which one is right. When platforms do not share a consistent customer ID they will always produce different results for the same campaign. Budget decisions made inside that disagreement are made on data nobody has verified.
06. Integrations That Break Without Warning
A vendor pushes a routine update on Friday afternoon. By Monday the connection between the MAP and the CDP has stopped working. Segments are no longer syncing. Campaigns are running on data that is eleven days old.
Nobody knows until a campaign manager notices something unusual and starts investigating. The longer the failure goes undetected the more campaigns run on stale data and the more customers receive experiences that no longer reflect reality.
Metrics You Need Before the Audit Begins
Before the audit begins you need seven numbers. Not to benchmark against industry averages. To understand what your stack is actually producing right now.
If a metric is unavailable that is not a gap to fill later. That is your first audit finding.
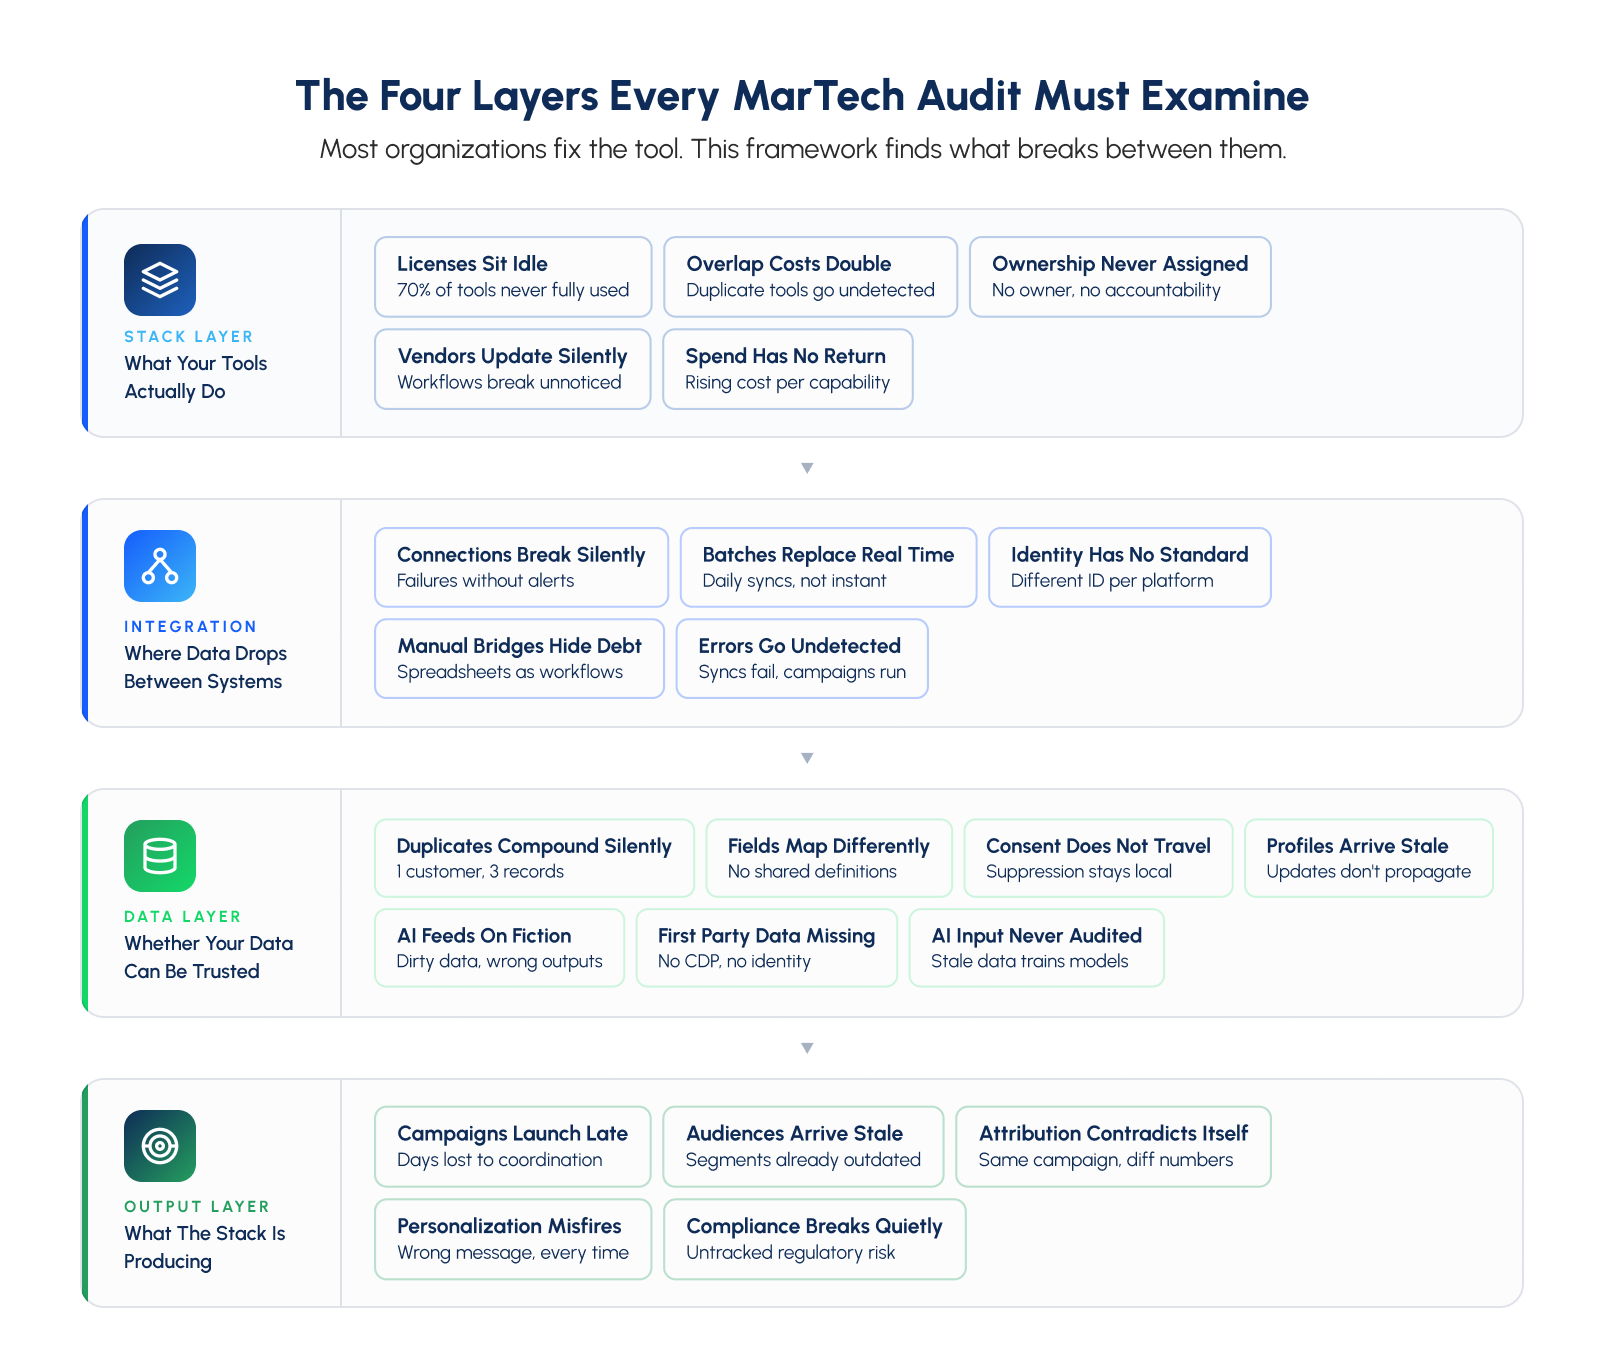
Stack Layer: What your tools are actually doing
01. Platform Utilization Rate : Features actively used ÷ Total features available × 100 = What your stack is actually worth
Measures the percentage of licensed capability your team actively uses across every platform in the stack. This is the most revealing number in any MarTech audit and almost nobody tracks it formally.
A platform sitting at 20 percent utilization is not a bad tool. It is a disconnected one. Either the integration was never completed, the workflow was never built, or the team never received meaningful adoption support. All three are fixable. None are visible without this number.
Where to look: Admin usage dashboards inside each platform. Most enterprise tools surface feature level usage data under settings or account management.
02. Integration Health Score Active real time integrations ÷ Total integrations in stack = How connected your platforms actually are
Measures the ratio of fully functioning real time integrations against every connection in the stack. A count of working versus broken connections is not enough. An integration that syncs data daily when it should sync in real time is not healthy. It is batched. And batched data means every campaign downstream is running on information that is already out of date.
Manual CSV exports and spreadsheet bridges are not integrations. They are unmonitored risks that break silently and compound quietly across every campaign that depends on them.
Where to look: Integration logs inside each platform. Error rate reports from your iPaaS or middleware layer if one exists in the stack.
Stack Output Layer: What your stack is producing
03. Campaign Launch Velocity Sum of all campaign launch days ÷ Total campaigns measured = Average days to launch
Measures how long it actually takes to move a campaign from approved brief to live execution. This number is the clearest operational indicator of stack health available to any marketing team.
Best in class enterprise stacks with direct platform integrations launch complex multi-channel campaigns in 3 to 5 days. Simple single channel campaigns in under 48 hours. Most organizations running disconnected platforms take 7 to 14 days because manual steps are embedded inside every handoff between systems. Those manual steps are invisible until you time them.
Where to look: Project management tool timestamps. Campaign logs in the MAP. Brief to launch dates across the last quarter.
04. Audience Sync Latency Time action reflected across all platforms − Time of customer action logged = Sync gap in hours
Measures how long it takes for a customer behaviour to reach every platform that needs to act on it. A customer who converts should immediately exit acquisition campaigns, enter onboarding sequences, and update suppression lists across every connected platform.
Real time CDP environments with direct integrations achieve this in under one hour. Traditional MAP environments running scheduled batch jobs run at 24 to 48 hours. If a converted customer is still receiving acquisition messages the next day audience sync latency is the cause not the campaign.
Where to look: CDP event logs. MAP audience refresh timestamps. Integration sync schedules inside each platform connection.
Data Layer: Whether your data can be trusted
05. Data Duplication Rate Duplicate customer records ÷ Total customer records × 100 = How fractured your customer view actually is
Measures the percentage of duplicate customer records existing across platforms in the stack. Above 10 percent means the same customer is being treated as multiple people across campaigns simultaneously.
The consequences are immediate and compounding. Retargeting fires on closed deals. Frequency caps break because the system does not know it has already contacted this person. Suppression lists fail. Personalization misfires because the profile being used is incomplete. Every duplicate record is a data integrity failure that reaches a real customer in a real moment.
Where to look: CRM deduplication reports. CDP identity resolution logs. Email platform bounce and unsubscribe analysis.
06. Attribution Consistency Score *Highest platform conversion count − Lowest platform conversion count ÷ Highest count × 100 = Variance percentage
Measures how consistently every platform in the stack reports the same campaign result. Pull the same campaign from the ESP, the CRM, the analytics tool, and the ad platform simultaneously. If the numbers disagree, attribution is broken.
A variance above 15 percent means budget allocation decisions are being made on data that does not agree with itself. Every channel investment decision, every campaign performance review, and every quarterly forecast built on inconsistent attribution is built on a foundation nobody has formally verified.
Where to look: Side by side comparison of campaign reports across every platform for the same date range and campaign identifier.
Financial Layer: What the stack is worth and what running it broken costs
07. MarTech Spend Efficiency Ratio Total annual MarTech spend ÷ Percentage of capabilities actively used = True cost per utilized capability
Measures the real cost of what the stack is delivering against what it is being paid to deliver. This is the number that reframes every other audit finding from an operational observation into a financial consequence.
If the annual stack costs 500,000 dollars and only 33 percent of capabilities are actively used the organization is effectively paying the equivalent of 1.5 million dollars for the value it is actually receiving. Every percentage point of utilization recovered is direct return on an investment already made.
Where to look: Finance records. Vendor contracts. License agreements. Usage dashboards per platform.
MarTech Metrics Scorecard
| Metric | Scale | Healthy | Warning | Critical |
|---|---|---|---|---|
| Platform Utilization Rate | 0 to 100% | Above 70% | 40 to 70% | Below 40% |
| Integration Health Score | 0 to 100% | Above 80% | 60 to 80% | Below 60% |
| Campaign Launch Velocity | Days | Under 5 days | 5 to 10 days | Above 10 days |
| Audience Sync Latency | Hours | Under 1 hour | 1 to 24 hours | Above 24 hours |
| Data Duplication Rate | 0 to 100% | Below 5% | 5 to 10% | Above 10% |
| Attribution Consistency Score | 0 to 100% | Below 5% variance | 5 to 15% variance | Above 15% variance |
| MarTech Spend Efficiency Ratio | Currency value | Rising | Flat | Declining |
The MarTech Audit Framework
Most organizations audit tools in isolation and stop there. But the stack layer only tells you what you are paying for. The integration layer tells you where it breaks. The data layer tells you whether it can be trusted. The output layer tells you what the disconnection is costing. All four together give you the complete picture.
One thing the stack layer consistently surfaces that most audits miss entirely is shadow IT. Tools purchased by individual teams outside central governance that create ungoverned data flows nobody in marketing operations knows exist. The audit finds those too.
How to Do a MarTech Audit
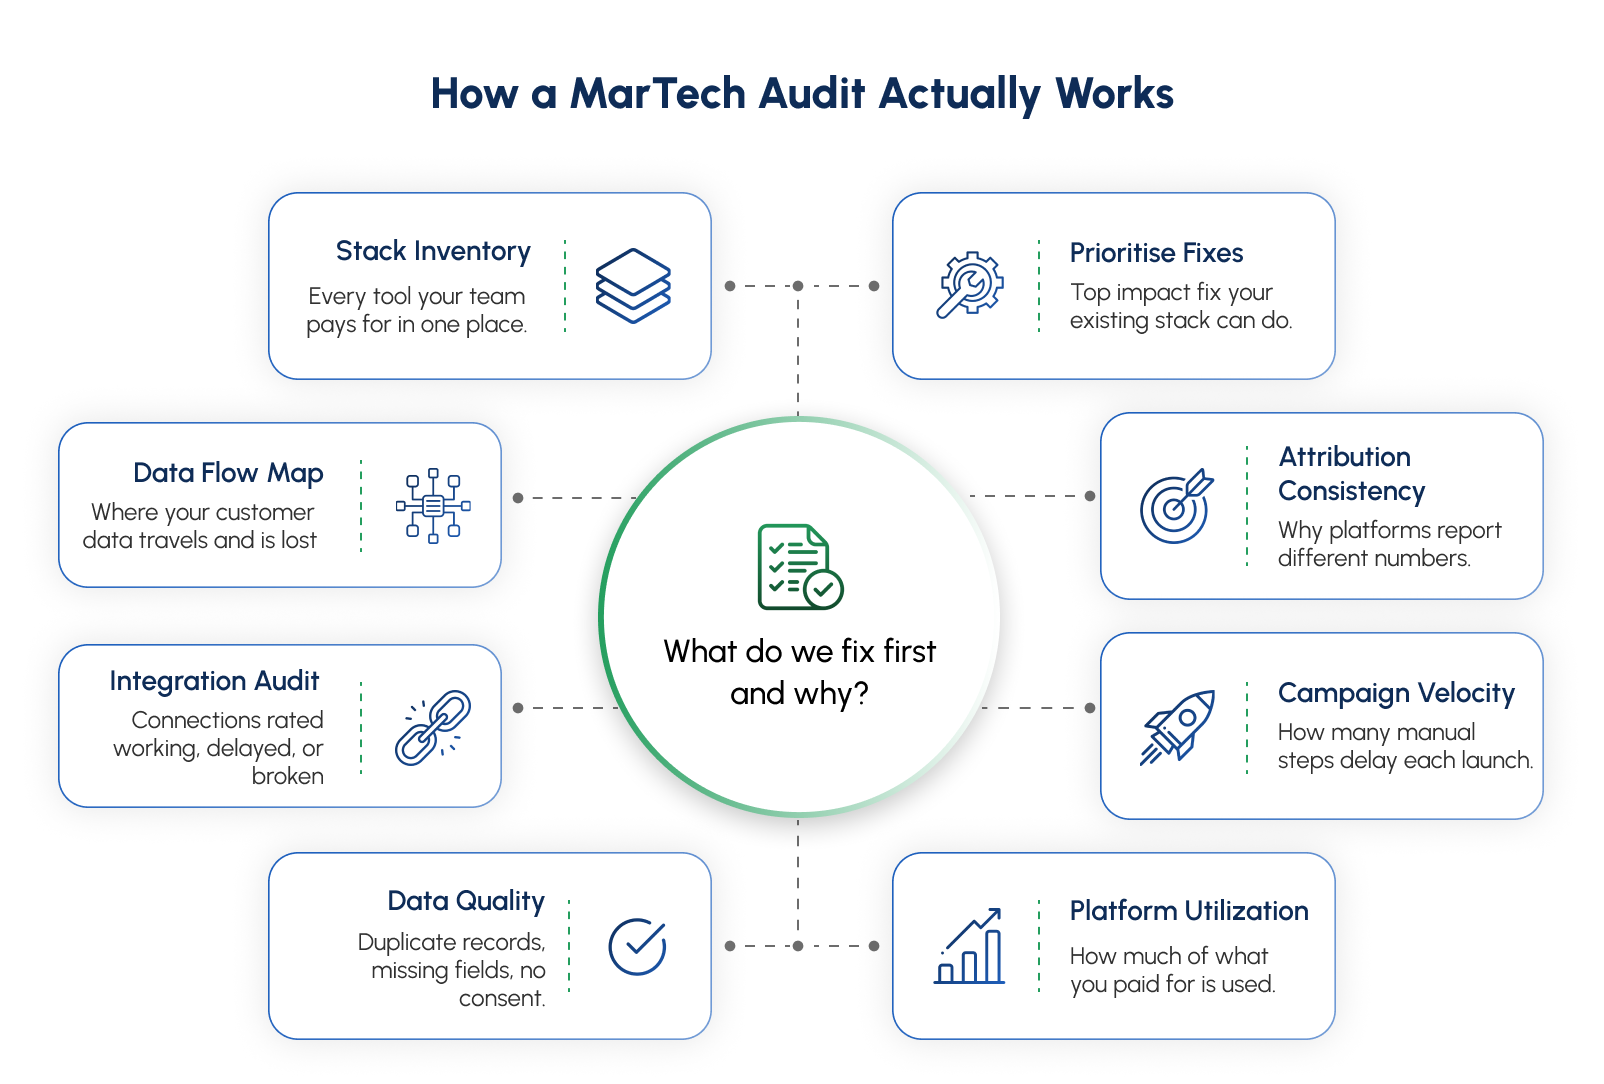
A MarTech audit is eight steps run in sequence. Each one moves from symptom to system to the specific break causing the problem. Every step produces a finding. Every finding feeds one final answer.
01. Build the Full Stack Inventory
You cannot audit what you cannot see.
List every tool, every license, and every spend line across the entire marketing technology environment. Start with the obvious. The MAP. The CRM. The CDP. The analytics suite. Then go deeper.
The tool someone signed up for during a free trial that became a paid subscription. The platform three people use once a quarter. The scheduling tool the agency set up two years ago that nobody inside the team owns anymore.
Most organizations discover 3 to 5 tools they forgot existed. This is where MarTech consolidation decisions begin. Not in a vendor meeting but in the inventory step of an audit.
You leave with: A complete stack inventory showing every tool, its annual cost, its named owner, and its stated purpose.
02. Map Every Data Flow
Your platforms look connected. Most of them are partially connected at best.
Trace how data moves between every platform. Where does a lead record go after it is created? Where does a purchase event go after it fires. Where does a customer profile update after a support interaction closes.
Then find where it stops.
A purchase event that updates the commerce platform but never reaches the email suppression list. A customer preference that exists in the CDP but never reaches the personalization engine. Every gap is a campaign running on incomplete information without anyone knowing.
You leave with: A data flow map showing every connection, every gap, and every place where data stops moving.
03. Audit Every Integration
For each connection between platforms ask five things.
Is data arriving? Is it real time or batched? Is the customer ID consistent across both systems? Is the same customer recognised as the same person on both sides. Is there active monitoring that alerts someone if the connection fails silently.
That last question matters most. Most integrations have no monitoring layer. They run until they break. Nobody knows until a campaign misfires.
One more thing. Manual CSV exports and spreadsheet bridges are not integrations. They are workarounds with a human dependency attached. Document every one of them.
You leave with: An integration health map rating every connection as real time, batched, manual, or broken.
04. Audit Data Quality
A functioning integration carrying bad data is more dangerous than a broken one.
Check for duplicate customer records across platforms. A customer who exists as three separate records is receiving three separate experiences simultaneously. None of them are accurate.
Check for inconsistent field mapping between systems. The word active means different things in different platforms.
In the CRM it might mean logged in within 90 days.
In the MAP it might mean opening an email within 30 days.
In the CDP it might mean making a purchase within 12 months.
When these definitions conflict every segment built on activity data is built on a contested foundation.
Finally examine first party data infrastructure. With third party cookies gone and privacy regulations tightening the audit must examine whether the organization has a functioning consent management platform, a properly configured CDP, and a viable identity resolution strategy that does not depend on third party signals.
You leave with: A data quality report showing duplication rate, field mapping conflicts, consent infrastructure gaps, and identity resolution health.
05. Measure Platform Utilization
Log into each platform and check what is actually being used against what is being paid for.
Most enterprise platforms surface feature level usage data in their admin sections. Pull this for every platform in the stack. The gap between what is licensed and what is used is the dormant spend number.
It is almost always larger than anyone expects.
Pay particular attention to automation capabilities, segmentation features, and integration connectors that were licensed but never implemented. The capability exists. It was simply never connected or activated. This is where MarTech optimization begins. Not with new tools but with what is already paid for and sitting idle.
You leave with: A utilization report showing active versus dormant capability per platform and the recoverable spend attached to each.
06. Test Campaign Velocity
Time a campaign from brief to live.
Take the last ten campaigns. Pull the date the brief was approved and the date the campaign went live. Calculate the average. Then walk through each one and count every manual step.
Every data export. Every upload. Every cross platform validation. Every approval that required reconciling numbers from two different systems.
Each manual step compounds across every campaign in the year.
50 campaigns. 7 days to launch each one. That is 350 days a year lost to manual coordination between platforms that were never properly connected.
You leave with: A velocity audit showing exact time cost per campaign stage and which manual steps are generating the most delay.
07. Audit Attribution Consistency
Pull the same campaign result from every platform that touches it simultaneously.
The ESP. The CRM. The analytics tool. The ad platform. The CDP. Line them up. Same campaign. Same date range. Same conversion event.
If the numbers disagree, attribution is broken.
A variance above 15 percent means budget decisions are being made on data that does not agree with itself. Every channel investment decision built on this data is built on a foundation nobody has formally verified.
This step also surfaces AI model risk. If the stack runs predictive scoring or automated segmentation examine the training data those models run on. A model trained on inconsistent or duplicate data produces confident outputs that point in the wrong direction.
You leave with: An attribution consistency scorecard showing variance per platform and the specific failure causing the disagreement.
08. Prioritise the Fixes
You have findings. Now you need one answer.
Stack every finding against two criteria. Revenue impact and complexity of the fix using the existing stack.
High impact with low complexity goes first.
High impact with high complexity gets planned and properly resourced.
Low impact gets deprioritised entirely.
The audit does not produce a list of problems. It produces one clear answer on what to fix first, what fixing it is worth, and what the existing stack already has to fix it with.
You leave with: One prioritised fix list with a clear evidence backed answer on where to start and what each fix is worth in recovered campaign output, recovered spend, and recovered data integrity.
You Know Campaigns Are Breaking. Now Find Why.
Campaigns do not underperform because of strategy. They underperform because of what happens between the platforms running them.
A segment that never synced. An integration that broke and nobody noticed. A converted customer is still receiving acquisition messages because the purchase event never reached the suppression list.
None of this shows up in the campaign report. It shows up in the results.
The audit finds the exact break. Not tool recommendations. One specific integration failure traced to its root cause with a fix that works inside the platforms already running in your environment.
The fix is almost never a new tool. It is fixing what existing tools were never properly connected to do.
The Bootcamp fixes it in 5 days. Built inside your existing stack. Validated against your real data. Owned by your team from day one.
The break is already there. In the integration batching when it should be real time. The customer ID creates duplicate records. The attribution model reports different numbers to every stakeholder.
Every week it stays unfound is another week it compounds.
Bootcamp Model
We deliver MarTech optimization through a focused 5-day Bootcamp.
We work inside your real stack. Your actual integrations. Your actual data flows. And deliver a working fix in 5 days. Not an integration report. Not a slide deck of disconnected recommendations.
FAQ section
01. We already run platform health checks. Do we still need a MarTech audit?
Platform health checks tell you if a tool is running. They do not tell you if the data flowing through it is accurate, arriving on time, or reaching the next platform it needs to reach. A MarTech audit looks at what the health check never sees.
02. We recently redesigned our campaign workflows. Why would breaks still exist?
Workflow redesigns fix the process layer. Most breaks live in the integration layer underneath. A redesigned workflow running on the same disconnected stack produces the same data drops, the same batch delays, and the same duplicate records as before. The workflow changed. The architecture did not.
03. Our attribution numbers look acceptable. Should we still audit?
Acceptable attribution numbers do not mean attribution is accurate. They mean the variance between platforms has not been formally measured yet. Most organizations that run the attribution consistency check for the first time discover a variance above 15 percent. Budget decisions have been made on that data the whole time.
04. How do we know which integration failure to fix first?
Step eight of the audit answers exactly this. Stack every finding against two criteria. Revenue impact and complexity of the fix using the existing stack. The break affecting the most campaigns that can be fixed with what already exists goes first.
05. We do not have a dedicated MarTech operations team. Can we still run this?
Yes. The audit requires access to platform admin dashboards, integration logs, and campaign data. It does not require a dedicated team. A small cross functional group with access to the right systems can run every step.