
You are in Digital Analytics - Data Visualization
Replace Manual Reports With Automated Insights
Connect every source and automate every refresh so insights arrive the moment they're needed.
Are Your Reports Arriving After the Opportunity Has Passed?
Data is available. Dashboards exist. Analysts export files, reconcile numbers, validate formulas, and rebuild reports manually. What should take hours stretches into days.
Reports Built Manually

What Happens: Teams extract data from multiple systems, reconcile inconsistencies, and prepare reports manually. Analysis waits days for completion.
Real Scenario: Sales and marketing data exported separately. Analysts spend eight hours cleaning aligning fields before analysis begins. Report delivered three days after request. Decision window closed. Opportunity missed.

Insights Delayed Days
What Happens: Reports built periodically not dynamically. Updates require refresh cycles and manual validation. Real-time visibility impossible.
Real Scenario: Campaign underperforms Tuesday mid-week. Analysis requested immediately. Manual extraction required. Report delivered 3 days later. Campaign underperformed entire week. The budget was wasted completely.

Dashboards Lack Drill-Down
What Happens: Dashboards present historical summaries but lack drill-down capability. New report builds required for every segmentation question.
Real Scenario: Revenue dips Western region Monday. Executives request segmentation analysis. Dashboard lacks drill-down. New report build required. Analysts deliver breakdown Thursday. Root cause too late.

How We Fix It
We automate data consolidation, accelerate insight generation, and redesign visualization for decision velocity.
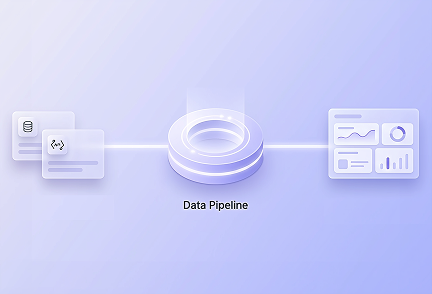
What We Build
An automated data pipeline that consolidates and validates reporting inputs.
How We Build It
- Integrate data sources into a unified reporting layer for consistent insights delivery
- Standardize metrics and definitions across systems to ensure alignment and clarity
- Automate data cleansing and transformation to improve accuracy and reduce manual effort
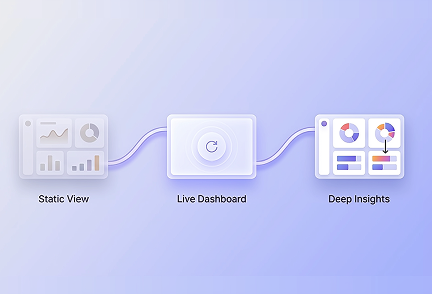
What We Build
Dynamic dashboards that update automatically and support real-time analysis.
How We Build It
- Configure automated refresh intervals to ensure timely and consistent data availability
- Enable drill-down and segmentation capabilities for deeper performance analysis
- Predefine key business performance views to align reporting with strategic goals
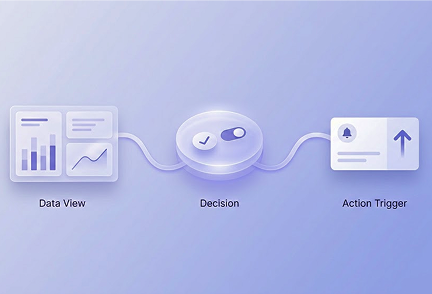
What We Build
A reporting framework designed for action, not just observation.
How We Build It
- Map dashboards to specific business decisions to ensure clear and action-oriented insights
- Align KPIs to operational triggers to enable timely and effective business responses
- Embed alert systems for threshold breaches to proactively manage performance


What You Get
Faster reporting. Immediate insights. Timely decisions.
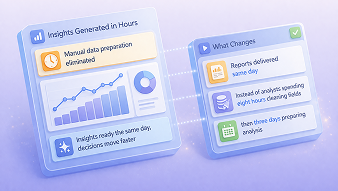
Insights Generated in Hours
Manual data preparation eliminated.
Reports delivered same day instead of analysts spending eight hours cleaning fields then three days preparing analysis.
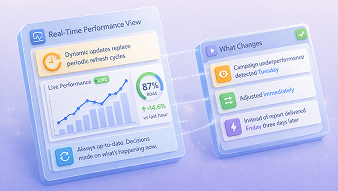
Real-Time Performance View
Dynamic updates replace periodic refresh cycles.
Campaign underperformance detected Tuesday and adjusted immediately instead of report delivered Friday three days later.
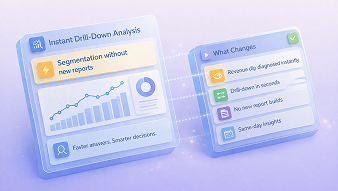
Instant Drill-Down Analysis
Segmentation accessible without new report builds.
Revenue dip diagnosed Monday using instant drill-down instead of new report build required delivered Thursday.
Digital Analytics Products for Real-Time Decisions
Enterprise-ready analytics products that standardize measurement, reduce noise, and keep decisions aligned in real time.

Continuously analyze data and surface insights automatically
Get early alerts when performance drops, translate data into clear summaries for non-analysts, and uncover patterns and anomalies manual reporting often misses.
Book a Demo →From Reporting to Control. In Four Moves.
Most analytics stop at visibility. We build the system that drives action.
Start with a Bootcamp
Bootcamp
 (5 Days)
Fix one decision blocker fast
We start with one live problem: attribution disputes, delayed performance signals, fragmented journeys, or profit blind spots.
In 5 days, we rebuild that loop end-to-end across the systems involved, so the number becomes usable, not debatable.
You see the fix working on your data, with clear before/after impact.

Launchpad
(60 Days)Make the fix production-grade and run it daily
Once it works, we take it live with real traffic, real refresh schedules, and real ownership.
Monitoring and guardrails are added so performance doesn’t drift silently and definitions don’t get reinterpreted team by team.
By day 60, your teams can operate the system without depending on manual reconciliation cycles.
Rollout
Expand the same control loop across more decisions
With the foundation in place, we scale the pattern to the next bottleneck. Budget optimization, cohort retention, channel ROI, margin leakage, or journey drop-offs.
Each rollout moves faster because you’re not rebuilding identity, metrics, and signal flows from scratch.
Over time, analytics stops being a project and starts behaving like an operating capability.
Digital OS
Run analytics as an always-on decision layer
At this stage, analytics becomes the control layer that keeps the business aligned in real time.
Signals stay current. Attribution stays consistent. Journeys stay connected. Profit stays visible.
Teams don’t wait for monthly reporting to act. They adjust execution continuously, with confidence.
Case Studies From Real Enterprise Environments.
What broke, how we fixed it, and what the numbers showed.
View Case StudyCustomer journeys optimized using unified digital analytics
Web, mobile, and portal touchpoints were unified under a single analytics framework. Adobe Analytics was re-implemented to capture meaningful events and ensure accurate journey measurement.
Decision-Ready Analytics Starts Here
Attribution disputes. Stale performance. Split journeys. Pick one. We make it reliable enough to run daily.
Built with Enterprise-Grade Partners
20 years building on Adobe, Salesforce, IBM, HCL, SAS, and Microsoft. We know how to make them work as one system.


Customer Endorsements
"Congrats and thanks to entire Xerago team. The policy persistency model is live now, and development was done with clinical precision. It has an accuracy of 95%."
— Senior Vice-President, A Large Private Insurance Company, India
Digital Analytics Insights from the Field
Perspectives shaped by real analytics breakdowns and real production fixes.

Google Analytics 4 vs Adobe Analytics What Actually Changes
How data models, measurement depth, and enterprise needs determine the right analytics platform choice.
Read article
Choosing the Right Marketing Analytics Tools
How different analytics tools shape measurement, attribution, and decision-making across marketing teams.
Read article
Amplitude vs Adobe Analytics Product or Marketing Analytics
Where product behavior tracking ends and enterprise marketing analytics begins, and why it matters.
Read article