
DIGITAL ANALYTICS
Analytics as the System Behind Fast Decisions
Solve one enterprise analytics challenge in 5 days. Systematize it.
You Don’t Need More Dashboards. You Need the Right Data You Can Act On.
Every platform is generating numbers. But your business still waits. Performance data arrives 24–48 hours late. Attribution changes depending on which tool you open. Every insight becomes a BI ticket. Every budget shift becomes a meeting. So analytics turns into reporting. And reporting turns into delay. By the time the truth shows up, the money is already spent.
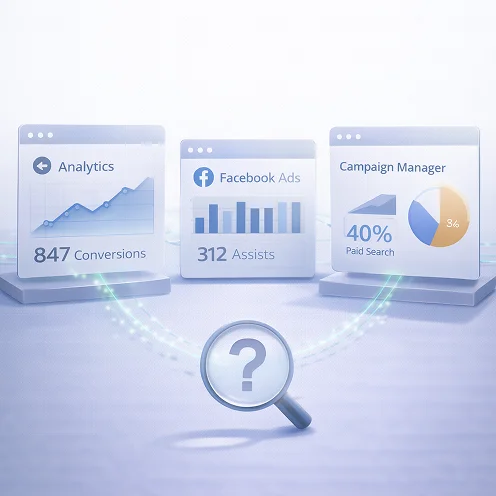
Attribution Systems Disagree on Revenue Sources

Google Analytics reports 847 conversions while Facebook claims 312 assists for the same $2.3M revenue month.
Campaign manager sees 40% attribution to paid search but finance shows only 18% revenue increase from search spend.
Performance Insights Arrive After Budget Decisions
Campaign data updates at 6 AM while budget meetings happen at 9 AM using 30-hour-old data.
Monday's budget shifts $50K from underperforming campaigns, but weekend recovery data doesn't arrive until Tuesday.
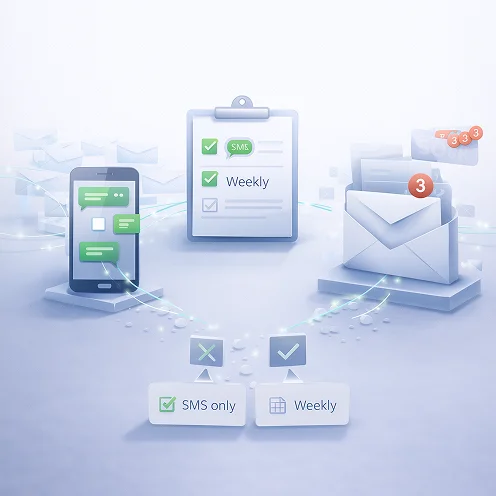
Business Teams Wait Days for Basic Reports
Marketing needs a 3-day turnaround from BI team to answer “which sources drive $500+ customers" for Thursday's meeting.
Customer behavior analysis takes 5 business days because analyst must combine web data with CRM data manually.
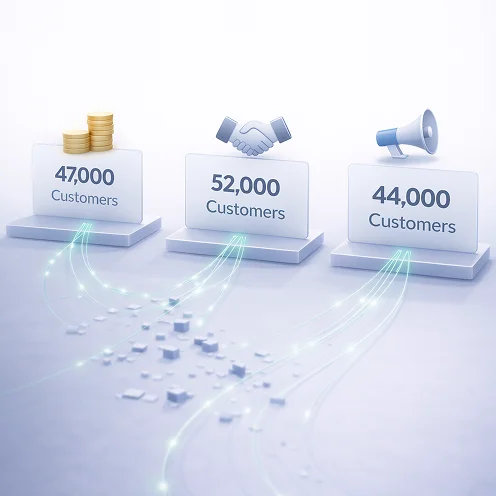
Customer Data Stays Split Across Channels
Web shows 15,000 visitors, mobile shows 8,000 users, but can't identify 3,000 using both channels.
Digital interactions track separately from offline engagement, missing complete customer journey in ROI calculations.
What Decision-Ready Analytics Looks Like
Not more charts. A system that tells you what’s happening and what to do next.
Live Performance, Not Next-Day Reporting
Live performance signals are unified across analytics, media, and business systems. Performance refreshes continuously, not next-day or next-week. Budget moves while outcomes are still changeable.
One Attribution Model Everyone Uses
Attribution logic is aligned across platforms and enforced through one shared reporting model. Revenue credit stays consistent across teams and tools. ROI decisions stop getting delayed by conflicting numbers.
One Journey View Across Every Channel
Customer identity is stitched across touchpoints to create one end-to-end journey view. Behavior stays connected instead of splitting by channel. Drop-offs surface early, and conversion improves faster.
Profit Signals Show Up Inside Performance
Margin, returns, refunds, and discount leakage are tied back to campaigns and cohorts. Profitability appears inside performance views, not after month-end. Spend shifts toward contribution, not vanity conversions.
Digital Analytics Products for Real-Time Decisions
Enterprise-ready analytics products that standardize measurement, reduce noise, and keep decisions aligned in real time.

Continuously analyze data, surface insights proactively, and reduce manual reporting cycles with AI-led intelligence.
Get alerts when performance drops before your boss asks about it. Turn data into natural language summaries so non-analysts can act on it. Spot patterns and anomalies that manual reporting misses.
Book a Demo →From Reporting to Control. In Four Moves.
Most analytics stop at visibility. We build the system that drives action.
Start with a Bootcamp
Bootcamp
 (5 Days)
Fix one decision blocker fast
We start with one live problem: attribution disputes, delayed performance signals, fragmented journeys, or profit blind spots.
In 5 days, we rebuild that loop end-to-end across the systems involved, so the number becomes usable, not debatable.
You see the fix working on your data, with clear before/after impact.

Launchpad
(60 Days)Make the fix production-grade and run it daily
Once it works, we take it live with real traffic, real refresh schedules, and real ownership.
Monitoring and guardrails are added so performance doesn’t drift silently and definitions don’t get reinterpreted team by team.
By day 60, your teams can operate the system without depending on manual reconciliation cycles.
Rollout
Expand the same control loop across more decisions
With the foundation in place, we scale the pattern to the next bottleneck. Budget optimization, cohort retention, channel ROI, margin leakage, or journey drop-offs.
Each rollout moves faster because you’re not rebuilding identity, metrics, and signal flows from scratch.
Over time, analytics stops being a project and starts behaving like an operating capability.
Digital OS
Run analytics as an always-on decision layer
At this stage, analytics becomes the control layer that keeps the business aligned in real time.
Signals stay current. Attribution stays consistent. Journeys stay connected. Profit stays visible.
Teams don’t wait for monthly reporting to act. They adjust execution continuously, with confidence.
Real-World Digital Analytics Problems.Real Execution.
Practical digital analytics execution across web, mobile, and marketing systems without replatforming.
View Case StudyCustomer journeys optimized using unified digital analytics
Digital touchpoints across web, mobile, and portals were unified under a single analytics framework. Adobe Analytics was re-implemented to capture meaningful events, fix data integrity issues, and enable accurate journey measurement across acquisition and application flows.
Decision-Ready Analytics Starts Here
Attribution disputes. Stale performance. Split journeys. Pick one. We make it reliable enough to run daily.
Customer Endorsements
"Congrats and thanks to entire Xerago team. The policy persistency model is live now, and development was done with clinical precision. It has an accuracy of 95%."
— Senior Vice-President A Large Private Insurance Company, India
Built with Enterprise-Grade Partners
20 years building on Adobe, Salesforce, IBM, HCL, SAS, and Microsoft. We know how to make them work as one system.


Our Take on What Breaks and What Works
Patterns, failures, and fixes observed across real customer experience environments.

Why Platforms Fail After Deployment
Most systems work in testing but collapse under real conditions. The gap isn't technical, it's operational.
Read article
Intent Without Action Is Just Expensive Data
Every platform captures signals. Almost none trigger intervention while it matters. The gap between knowing and doing is where revenue disappears.
Read article
Orchestration Beats Integration Every Time
Connecting systems isn't the goal. Making them execute as one operational layer is. Most "integrations" are just data syncs that break under load.
Read article