Interactions Correctly?


How to Perform a Digital Analytics Audit: A Step-by-Step Framework
Authored by Ram Prabhakar
Published: December 05, 2024 | Updated: July 16, 2026
Your marketing and data teams and especially whoever owns analytics accuracy across your organization, need more than a dashboard. They need a way to confirm that what the dashboard shows is actually what happened.
That's the gap a digital analytics audit is built to close, and this guide walks through exactly how to run one.
In this guide, you'll learn what an audit checks, how it differs from a broader analytics assessment, and how to keep tracking accurate long after the audit ends so you can:
- Know with confidence whether the metrics you're reporting on actually reflect what users did
- Catch the gap between "our dashboard looks fine" and "our dashboard is quietly wrong"
- Stop chasing vanity metrics and start tracking the numbers that hold up under scrutiny
- Turn a one-time cleanup into an ongoing discipline that survives the next redesign or campaign
- …and see exactly where Xerago TrueMeasure fits into making all of the above automatic
What is a Digital Analytics Assessment?
A digital analytics assessment is a comprehensive evaluation of how effectively an organization gathers, analyzes, and uses its digital data.
It's not just about confirming the numbers add up, it's about understanding the context behind them and aligning what you're measuring with actual business goals.
Done properly, it reveals gaps, surfaces untapped opportunities, and gives leadership the confidence to act on what the data says. Companies using data-driven marketing are six times more likely to be profitable, but only if the assessment behind that confidence actually holds up.
That's what the audit portion of this process is for, and it's worth being specific about what it actually earns you.
1.1 Definition and Purpose
At its core, a digital analytics assessment seeks to answer three critical questions:
- Is the data being collected accurate and complete?
- Are the insights actionable and aligned with business objectives?
- How well does the analytics ecosystem support long-term growth and adaptability?
The primary goals of a digital analytics assessment include:
- Ensuring data accuracy: Verifying that the metrics you rely on truly reflect user behavior.
- Extracting actionable insights: Turning raw data into meaningful observations that drive decisions.
- Achieving strategic alignment: Ensuring that analytics efforts support your organizational goals, rather than existing in a vacuum.
1.2 Difference Between an Analytics Assessment and an Analytics Audit
While the terms “analytics audit” and “analytics assessment” are sometimes used interchangeably, they serve different purposes.
In simple terms, an analytics audit verifies whether your tracking tools, tags, and data collection processes are functioning correctly. An analytics assessment evaluates whether your analytics capabilities are generating meaningful business insights and supporting better decisions
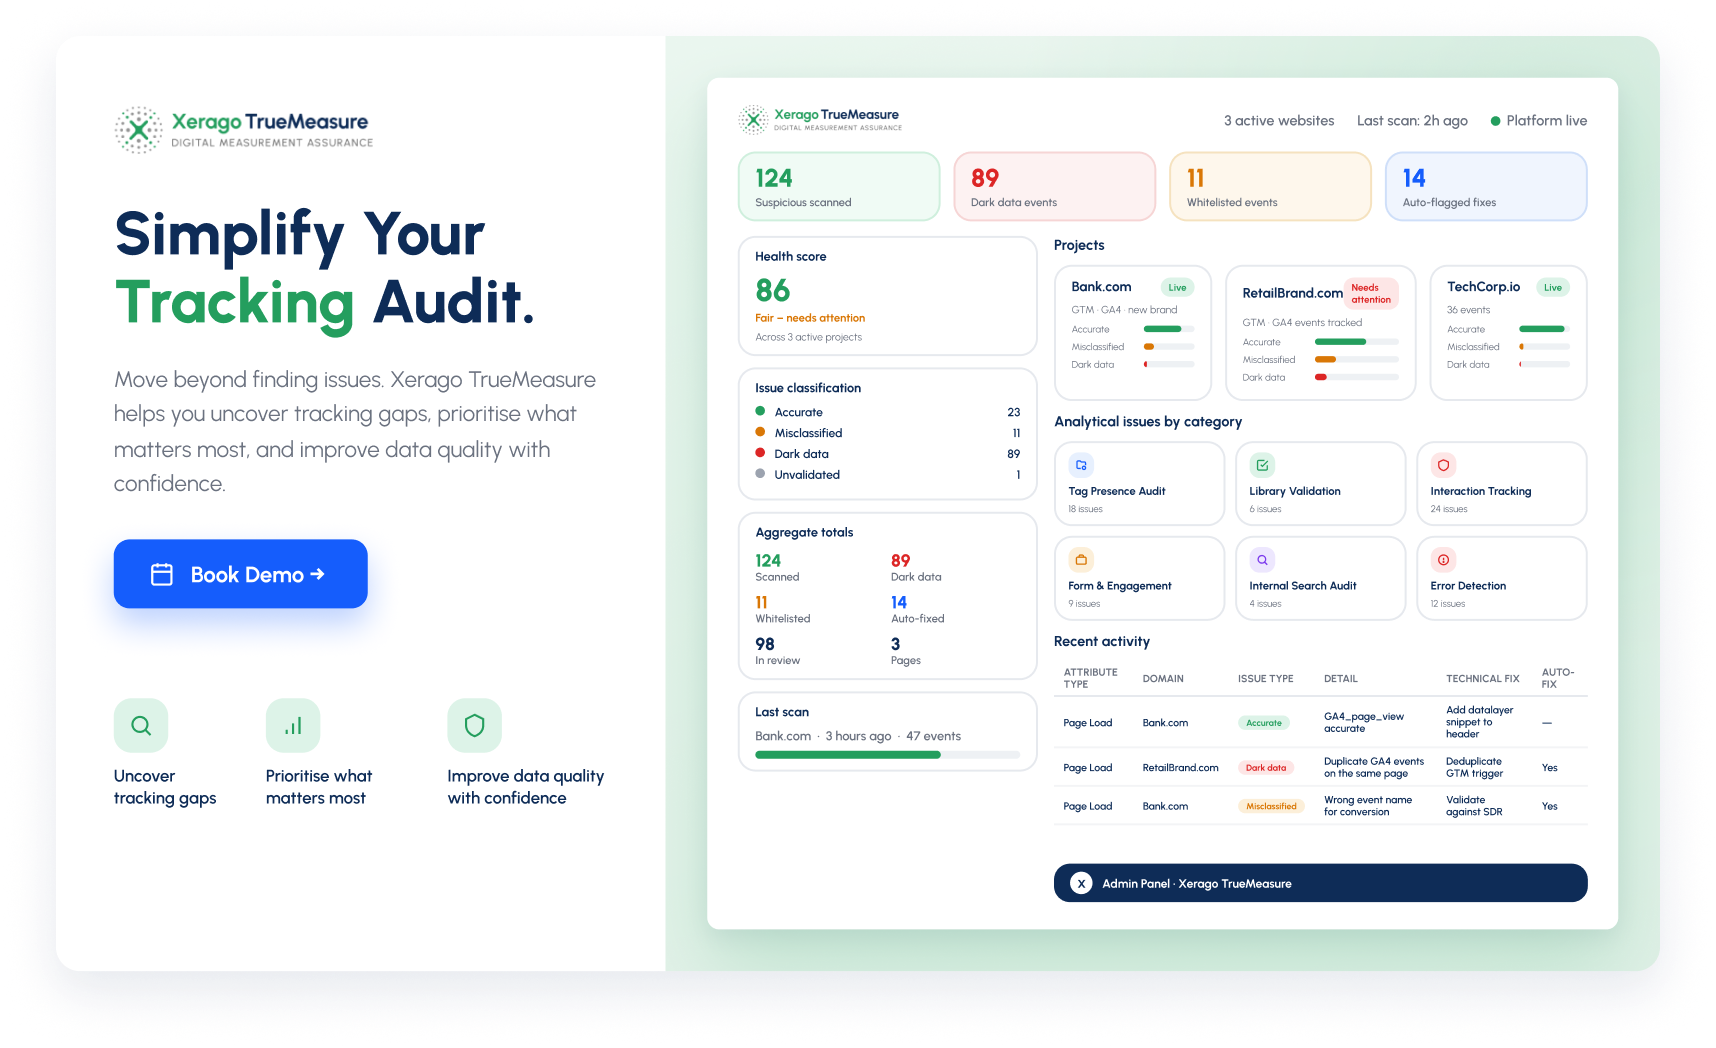
Which gap are you solving, the audit or the assessment?
TrueMeasure closes the gap between a clean audit and a working assessment.
See How TrueMeasure Works1.3 Common Misconceptions in Digital Analytics
Many organizations approach analytics with misconceptions that can undermine their efforts. Some of the most common include:
It’s all about finding errors. While correcting inaccuracies is vital, the real value lies in uncovering the stories the data tells and challenging existing assumptions.
All metrics are created equal. Vanity metrics like page views or social media impressions might look impressive but often fail to drive meaningful business outcomes.
We just need better tools. Advanced platforms and tools can help, but they’re only as effective as the strategy behind them.
The process of digital analytics assessment challenges these misconceptions, pushing businesses to dig deeper and focus on what truly matters: driving growth and better decision-making.
The Real Payoff of Verified Analytics
An audit confirms your tags are firing. An assessment confirms your strategy is working. Together, verified analytics pays off well beyond "cleaner dashboards" and Xerago TrueMeasure is built to deliver each outcome below:
- Trustworthy decisions. Every interaction is classified as Accurate, Mistracked, Dark Data, or Unutilized, so the numbers behind your strategy hold up the moment someone asks "are you sure?"
- Fewer strategies built on false signals. Catches mistracked events and dark data before they steer a quarter of decisions in the wrong direction.
- Cleaner campaign spend. Verifies conversion data before it reaches your ad platforms, so the budget follows what actually happened.
- Defensible segmentation and personalization. Confirms the behavior behind every segment actually occurred, before it's used to justify a strategy.
- Findings that don't expire. Control and Conquer monitor continuously and auto-heal tags: so what the audit and assessment found stays true, not just accurate on the day it ran.
Steps to Perform a Digital Analytics Assessment
Conducting a digital analytics assessment requires a methodical approach to ensure that every aspect of the analytics ecosystem is evaluated.
From aligning business objectives to uncovering hidden opportunities, these steps create a roadmap for businesses to transform their data into actionable insights.
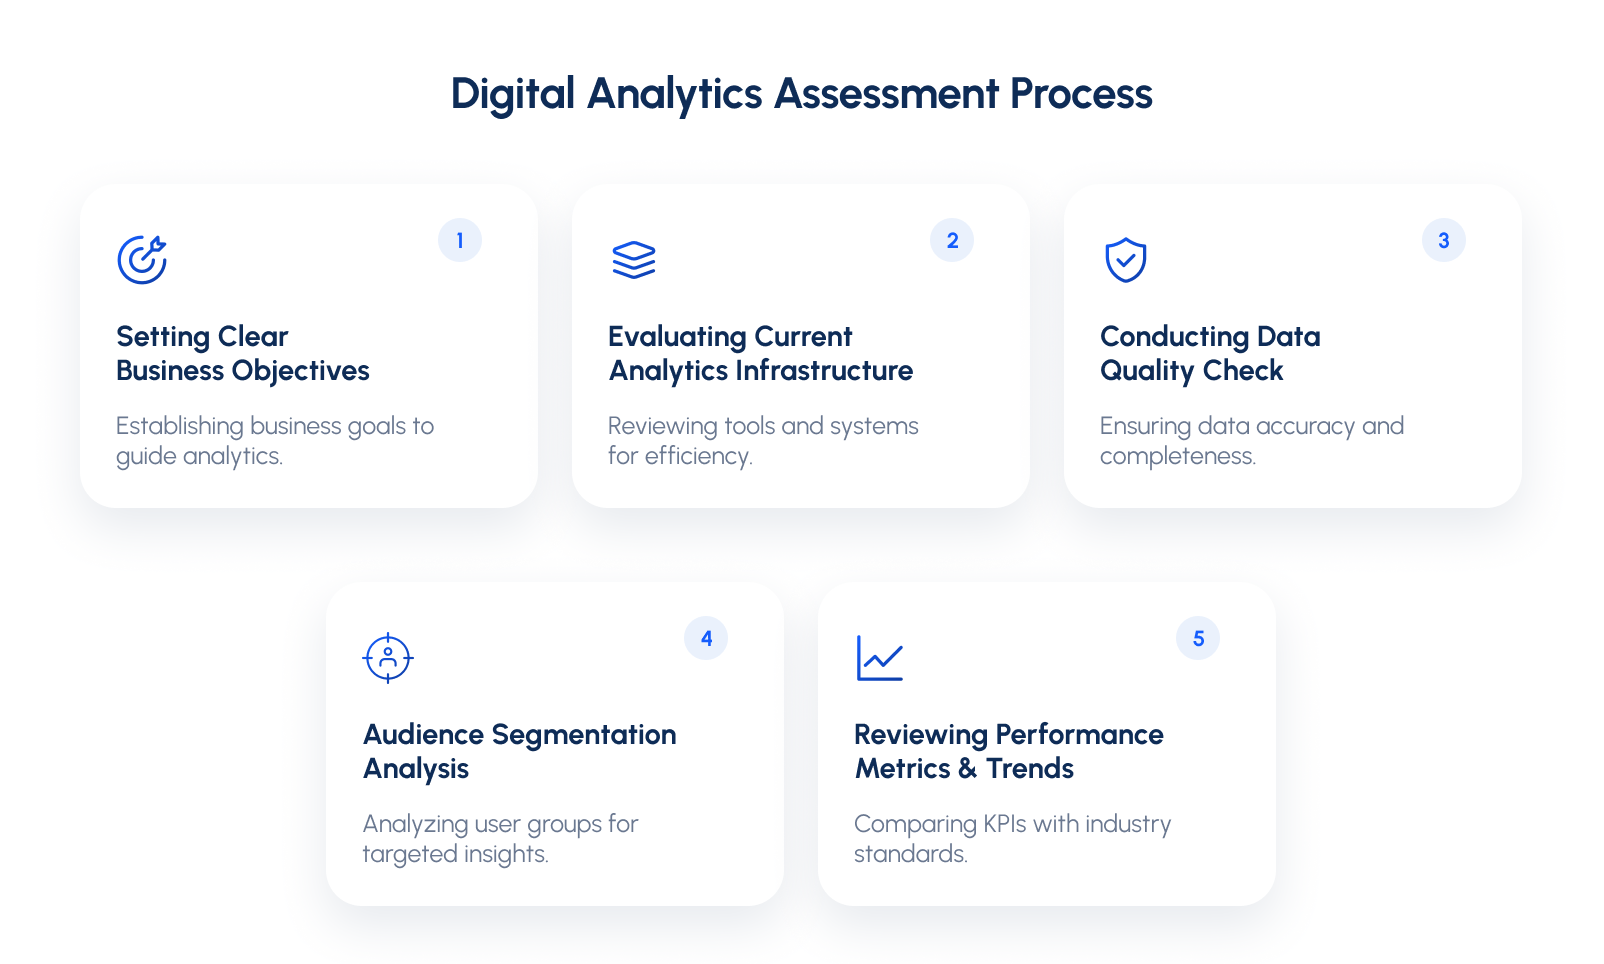
2.1 Setting Clear Business Objectives
Before diving into the technicalities of analytics, it’s crucial to understand what the business aims to achieve. Without a clear direction, even the most accurate data can fail to deliver meaningful insights.
Align Analytics with Business Goals: Every metric you track should tie back to your overarching objectives. For example, if the goal is customer acquisition, prioritize metrics like cost per acquisition (CPA) or new user sign-ups over less relevant data like page views.
Define Success Metrics: Identify the KPIs that indicate progress toward your goals. Avoid vague benchmarks and focus on measurable outcomes that demonstrate impact.
By starting with objectives, you ensure that the assessment is rooted in the organization’s unique needs, rather than chasing generic digital marketing strategies.
2.2 Evaluating the Current Analytics Infrastructure
The foundation of any analytics assessment lies in understanding the tools and systems in place. This step focuses on identifying inefficiencies, redundancies, and opportunities for improvement.
Audit Analytics Platforms: Review the software used for data collection, such as Google Analytics, Adobe Analytics, or specialized tools like Mixpanel. Are they configured correctly? Are they being fully utilized?
Identify Gaps in Implementation: Look for missing or inconsistent tracking tags, unmonitored customer journeys, or outdated configurations. These gaps can distort the data and mislead decision-making.
Assess Integrations: Evaluate whether analytics tools are integrated with other systems, such as customer relationship management (CRM) or marketing platforms, to enable holistic insights.
A robust infrastructure ensures the data is reliable, comprehensive, and ready to support strategic decisions.
2.3 Conducting a Data Quality Check
Once the infrastructure is evaluated, the next step is to assess the quality of the data being collected. Inaccurate or incomplete data is a common roadblock to effective analytics. Businesses lose nearly data quality research, which says poor data quality costs organizations an average of $12.9 million per year. IBM
Verify Data Accuracy: Cross-check the data against real-world results to ensure its validity. For example, does the number of transactions recorded in analytics match the actual sales?
Spot Missing or Duplicate Data: Identify gaps in customer journeys, such as drop-offs in tracking for mobile app users or inconsistencies across devices.
Examine Sampling Issues: Platforms like Google Analytics sometimes use sampled data, which can distort insights, especially for large datasets. Ensure data integrity by analyzing unsampled or raw data where possible.
The goal here is to establish trust in the numbers, providing a reliable basis for further analysis.
Xerago TrueMeasure automates exactly this check, classifying every interaction as Accurate, Mistracked, Dark Data, or Unutilized. On average, 15–30% of interactions fall into one of the last three buckets, a useful benchmark for your own audit.
2.4 Audience Segmentation Analysis
No two users are the same, and treating them as a homogenous group can lead to missed opportunities. Audience segmentation is a powerful way to uncover the nuances in user behavior.
Analyze Customer Groups: Break down users by demographics, behavior, or source of acquisition. For example, how do mobile users differ from desktop users in terms of engagement or conversions? Insights into customer behaviour can help drive this analysis.
Understand User Journeys: Map out how different segments navigate the website or app, identifying friction points or opportunities for optimization.
Discover Untapped Markets: Use segmentation to identify groups with high potential that might currently be overlooked, such as international audiences or returning users.
Effective segmentation allows for targeted strategies that resonate with specific audience needs, driving better results.
Segmentation is only as reliable as the tracking behind it. Xerago TrueMeasure confirms the behavior you're segmenting on actually happened.
2.5 Reviewing Performance Metrics and Trends
Finally, assess how well the current KPIs align with industry benchmarks and growth opportunities. This step helps organizations identify what’s working and where improvements are needed.
Compare against Industry Standards: How do your conversion rates, customer acquisition costs, or churn rates stack up against competitors? Identifying gaps can highlight areas for improvement.
Spot Emerging Trends: Look for patterns that signal opportunities, such as increasing mobile traffic or seasonal spikes in certain user behaviors.
By focusing on metrics that matter, businesses can align their strategies with market demands and position themselves for sustained growth.
With these foundational steps in place, the digital analytics assessment moves beyond simply auditing numbers. It becomes a proactive approach to improving business performance, guiding decisions that drive measurable impact.
3.1 Beyond the Numbers – Insights That Drive Action
Data is often celebrated for its objectivity, yet the way it’s collected, processed, and interpreted can be influenced by biases and blind spots.
A digital analytics assessment enables businesses to dig beneath the surface of raw metrics and discover the narratives that numbers alone may not immediately reveal.
Recognizing Patterns That Might Be Overlooked
At first glance, analytics data might seem straightforward - highlighting trends like rising website traffic, increased app downloads, or growing email open rates. However, the real power of analytics lies in understanding the subtle patterns within the data.
Behavioral Anomalies: Unusual spikes or drops in activity can point to important insights. For example, a sudden increase in bounce rates from mobile users might indicate a technical glitch or an under-optimized mobile experience.
A bounce-rate spike could be a UX problem or a mistracked event, Xerago TrueMeasure tells you which, before you act on the wrong one.
Emerging Trends: Consistently small but steady increases in searches for a specific product or feature might signal an opportunity to expand offerings or refine messaging.
Seasonal or Temporal Shifts: Patterns tied to time - such as peaks in usage during weekends or significant drop-offs during holidays - help businesses adjust campaigns, staffing, or product availability as part of effective digital presence management.
Recognizing and acting on these patterns allows organizations to optimize performance and anticipate customer needs before competitors.
Understanding How Biases Shape Data Interpretation
Even with perfect data collection, biases can influence how that data is analyzed and acted upon. These biases often arise from:
Preconceived Metrics Focus: Organizations sometimes overemphasize certain metrics because they align with established goals or internal narratives. For example, prioritizing social media engagement might overshadow critical customer retention metrics.
Selection Bias: Data that excludes certain user groups, such as those using older browsers or lower-end devices, can skew interpretations and miss opportunities to serve overlooked segments.
Confirmation Bias: Analysts might unintentionally focus on data that supports existing assumptions, ignoring contradictory insights that could reveal new opportunities.
For instance, a company might assume that a lack of engagement from older users is due to a lack of interest, rather than a poorly optimized user interface for that demographic. By questioning such assumptions, businesses can uncover valuable insights that might otherwise be ignored.
3.2 trackings and Techniques for Hidden Insights
Uncovering hidden narratives in data requires more than basic analytics dashboards. Businesses need advanced tools and methodologies to go beyond surface-level metrics and discover the deeper insights that drive growth.
Leveraging innovative technologies and visualization techniques can make all the difference in understanding user behavior and optimizing the digital experience.
Advanced Tools like AI/ML for Trend Analysis
Artificial intelligence (AI) and machine learning (ML) have revolutionized the way organizations analyze data, enabling deeper, faster, and more accurate insights. These technologies excel at detecting patterns and anomalies that might otherwise go unnoticed.
Trend Prediction: Machine learning models analyze historical data to forecast future behaviors. For example, they can predict a surge in demand for specific products based on seasonal trends or user activity patterns.
Anomaly Detection: AI tools can flag unexpected deviations, such as a sudden spike in bounce rates or a drop in app engagement, helping businesses address potential issues in real-time.
Personalization at Scale: Advanced analytics platforms use AI to segment users dynamically, offering personalized recommendations or targeted marketing campaigns based on past behaviors and preferences.
Example: An online streaming service uses machine learning to analyze viewing habits and recommend content to users, increasing watch time and subscription renewals.
Heat Maps and Session Recordings to Capture Context
While quantitative data provides the “what,” qualitative tools like heat maps and session recordings help businesses understand the “why” behind user behavior.
- Heat Maps: These tools visually represent where users focus their attention on a webpage. They highlight areas that receive the most clicks, taps, or scrolling activity supported by the best analytics tools.
- Session Recordings: These provide replayable videos of actual user interactions with a website or app.
Example: A travel booking website might use heat maps to discover that users rarely interact with filters on mobile devices. Session recordings then reveal that the filters are hidden behind an unintuitive dropdown, leading to an interface redesign and improved booking rates.
3.3 Translating Narratives into Business Strategy
The ultimate goal of uncovering hidden narratives in data is to turn insights into actionable strategies. While identifying patterns and behaviors is important, their true value lies in how effectively they influence decision-making and drive tangible outcomes.
By crafting clear, compelling stories from data and aligning those stories with business objectives, organizations can bridge the gap between insight and action.
Real-World Examples of Turning Insights into Actions
- Optimizing Conversion FunnelsA large e-commerce retailer noticed a consistent drop-off in its mobile checkout process. Session recordings revealed that users were abandoning their carts because the payment gateway took too long to load.Action: The company streamlined the checkout process by integrating a faster, mobile-friendly payment solution.Result: Mobile conversions increased by 25% within two months, contributing to a significant boost in overall revenue.
- Personalizing Marketing CampaignsA fitness app analyzed its user segments and found that new users who set goals within the first week had a 40% higher retention rate.Action: The app introduced a personalized onboarding experience that encouraged goal-setting, supported by automated reminders.Result: The app saw a 30% improvement in user retention rates and a noticeable increase in paid subscriptions.
Best Practices for Data Storytelling
Communicating insights effectively is just as important as uncovering them. Data storytelling combines analytical rigor with narrative techniques to present findings in a way that inspires action across teams and stakeholders.
- Start with the AudienceTailor your storytelling to the needs and knowledge levels of your audience. Executives may require high-level summaries with clear ROI implications, while technical teams might need detailed breakdowns and action plans.
- Focus on Key InsightsAvoid overwhelming your audience with every data point. Highlight the most impactful insights that directly support business objectives, ensuring clarity and focus.
- Use Visualizations StrategicallyTools like charts, graphs, and dashboards make data accessible and engaging. For example:
- Use bar graphs to compare trends over time.
- Employ heat maps to demonstrate user behavior on a specific webpage.
- Connect Insights to Outcomes
- Build a Narrative ArcStructure the story in three beats - current state, findings, recommendation.
- Current State: Engagement plateaued last quarter.
- Findings: Retention drops sharply after week two.
- Recommendation: Launch re-engagement campaigns in weeks two and three.
This arc does the real work: it turns a chart into a decision. Teams align faster, leadership signs off quicker, and the data stops being a report nobody reads and starts being the reason something changes.
Addressing Data Overload and Simplifying Analytics
Businesses today have access to more information than ever before. While this abundance can offer valuable insights, it often leads to data overload - a state where teams are overwhelmed by excessive metrics, complex reports, and unclear priorities.
Without a clear strategy to simplify analytics, organizations risk decision paralysis and inefficiencies.
This section explores the symptoms of data overload, strategies to focus on what matters, and how to streamline analytics for actionable insights.
4.1 Symptoms of Data Overload in Organizations
When organizations face data overload, the signs are often evident:
- Inefficient Reporting ProcessesTeams spend excessive time generating reports that lack focus or actionable insights. Reports are often overstuffed with metrics, many of which are irrelevant to business goals.
- Decision ParalysisThe sheer volume of data can make it difficult to prioritize actions. Leaders may delay decisions due to conflicting metrics or an inability to determine which data points carry the most weight.
- Over-Reliance on Vanity MetricsMetrics like social media impressions, page views, or email open rates are often celebrated but don’t directly correlate with meaningful outcomes like revenue growth or customer retention.
- Fragmented Data SystemsMultiple tools and platforms collect data independently, leading to inconsistencies and a lack of a unified view.These challenges hinder organizations from leveraging analytics effectively, limiting their ability to act decisively and strategically.
- Fragmentation gets worse when each fragment carries its own tracking gaps , worth verifying before you consolidate, not after.
4.2 Prioritizing Key Metrics
To combat data overload, organizations must focus on the metrics that matter most to their business objectives. This requires a clear distinction between vanity metrics and actionable KPIs.
Identify Metrics That Drive Business Growth
Focus on KPIs that directly impact outcomes, such as:
- Conversion rates.
- Customer acquisition costs (CAC).
- Customer lifetime value (CLV).
- Retention rates.
- Set Benchmarks and TargetsDefine clear benchmarks for each key metric, ensuring they align with industry standards or internal growth goals. This helps teams understand what success looks like and prioritize actions accordingly.
- Differentiate Vanity MetricsVanity metrics are often tempting to track because they look impressive but don’t directly influence strategic decisions. Instead of focusing on total website traffic, consider checklist the percentage of returning users or the number of goal completions.
4.3 Implementing a Simplified Analytics Framework
Consolidation only simplifies things if the underlying data is trustworthy, otherwise dashboards just get faster at showing the wrong numbers. Xerago TrueMeasure verifies what's flowing into GA, Adobe Analytics, and the rest of your stack, without adding another dashboard to reconcile.
A streamlined analytics framework ensures that teams can access the right data, in the right format, at the right time. Here’s how to simplify analytics while maintaining effectiveness:
- Consolidate Tools and Data SourcesReduce complexity by integrating analytics tools into a single platform or dashboard. For instance, combining CRM data with website analytics can provide a more holistic view of customer behavior.
- Customize Dashboards for Key StakeholdersCreate tailored dashboards for different teams to ensure that everyone sees the data most relevant to their responsibilities:
- Executives might need high-level metrics like revenue growth or market trends.
- Marketing teams benefit from campaign performance metrics like cost-per-click (CPC) or lead quality.
- Product teams focus on engagement, feature usage, and churn rates.
- Establish a Reporting CadenceSet a schedule for data reviews that balances frequency with meaningful insights. Weekly dashboards for ongoing campaigns and monthly deep dives for strategic planning can help maintain focus.
- Automate Where PossibleUse automation tools to generate recurring reports, send alerts for anomalies, and streamline routine data tasks. This reduces manual effort and minimizes errors.
Steps to Ensure Long-term Success After Assessment
A digital analytics assessment is only as valuable as the actions it inspires.
Once the initial evaluation is complete and insights have been implemented, businesses must focus on long-term strategies to maintain momentum, evolve with changing conditions, and sustain data-driven decision-making.
This section outlines the steps to ensure that analytics becomes an enduring source of growth and innovation.
5.1 Building a Culture of Data-Driven Decision-Making
Embedding analytics into the organization’s culture is critical for long-term success. A data-driven culture ensures that decisions across all levels are guided by evidence rather than intuition or guesswork.
- Encourage Cross-Functional Collaboration: Data should not live in silos. Foster collaboration between departments - such as marketing, product, sales, and customer service - to ensure a holistic approach to analytics. For example, marketing insights about customer preferences can inform product development.
- Train Teams to Interpret and Act on Data: Equip employees with the skills they need to understand and use analytics effectively. Regular workshops, certifications, and internal training sessions can empower teams to interpret dashboards, identify opportunities, and take action confidently.
- Make Data Accessible: Use centralized platforms to democratize access to key metrics. When employees across departments can view and understand data, they’re more likely to incorporate it into their decision-making processes.
5.2 Continuous Monitoring and Optimization
Analytics is not a one-time project—it’s an on-going process that requires regular monitoring and refinement.
- Establish a Review CycleCreate a routine for revisiting analytics strategies, tools, and performance. For example:
- Weekly checks for campaign metrics.
- Monthly reviews of KPIs against targets.
- Quarterly evaluations of overarching analytics strategies.
- Adapt to Evolving Business NeedsAs the business grows, so do its data requirements. Monitor whether existing KPIs remain relevant and adjust them to reflect new objectives or market conditions.
- Experiment and TestUse A/B testing, multivariate analysis, or pilot programs to refine strategies based on real-world results. Testing ensures that actions informed by analytics deliver measurable benefits.
Weekly, monthly, and quarterly reviews are only useful if the data behind them stays accurate between checks; a snapshot audit tells you the truth once, not continuously. With Xerago TrueMeasure covers the full lifecycle:
- Clarity for the initial audit
- Control for continuous monitoring between review cycles,
- Conquer to auto-heal issues directly in your tag manager, no developer queue required.
Conclusion
A digital analytics assessment serves as the key to unlocking this potential, offering a structured way to align data strategies with business objectives, uncover hidden narratives, and drive growth.
By embracing a broader perspective - one that questions assumptions, prioritizes actionable insights, and focuses on long-term outcomes - organizations can turn their analytics efforts into a strategic advantage.
The steps outlined in this article - setting clear objectives, addressing data overload, uncovering hidden narratives, and ensuring ongoing optimization - provide a roadmap for any business seeking to harness the full power of its digital analytics.
Ultimately, analytics is not about the numbers; it's about the decisions those numbers inspire and those decisions are only as good as the tracking behind them. If you're wondering how much of your own data is Mistracked, Dark, or Unutilized, that's the question Xerago TrueMeasure answers, and fixes.




Global Office Locations
2570 N. First Street, Suite 200,
San Jose, CA 95131